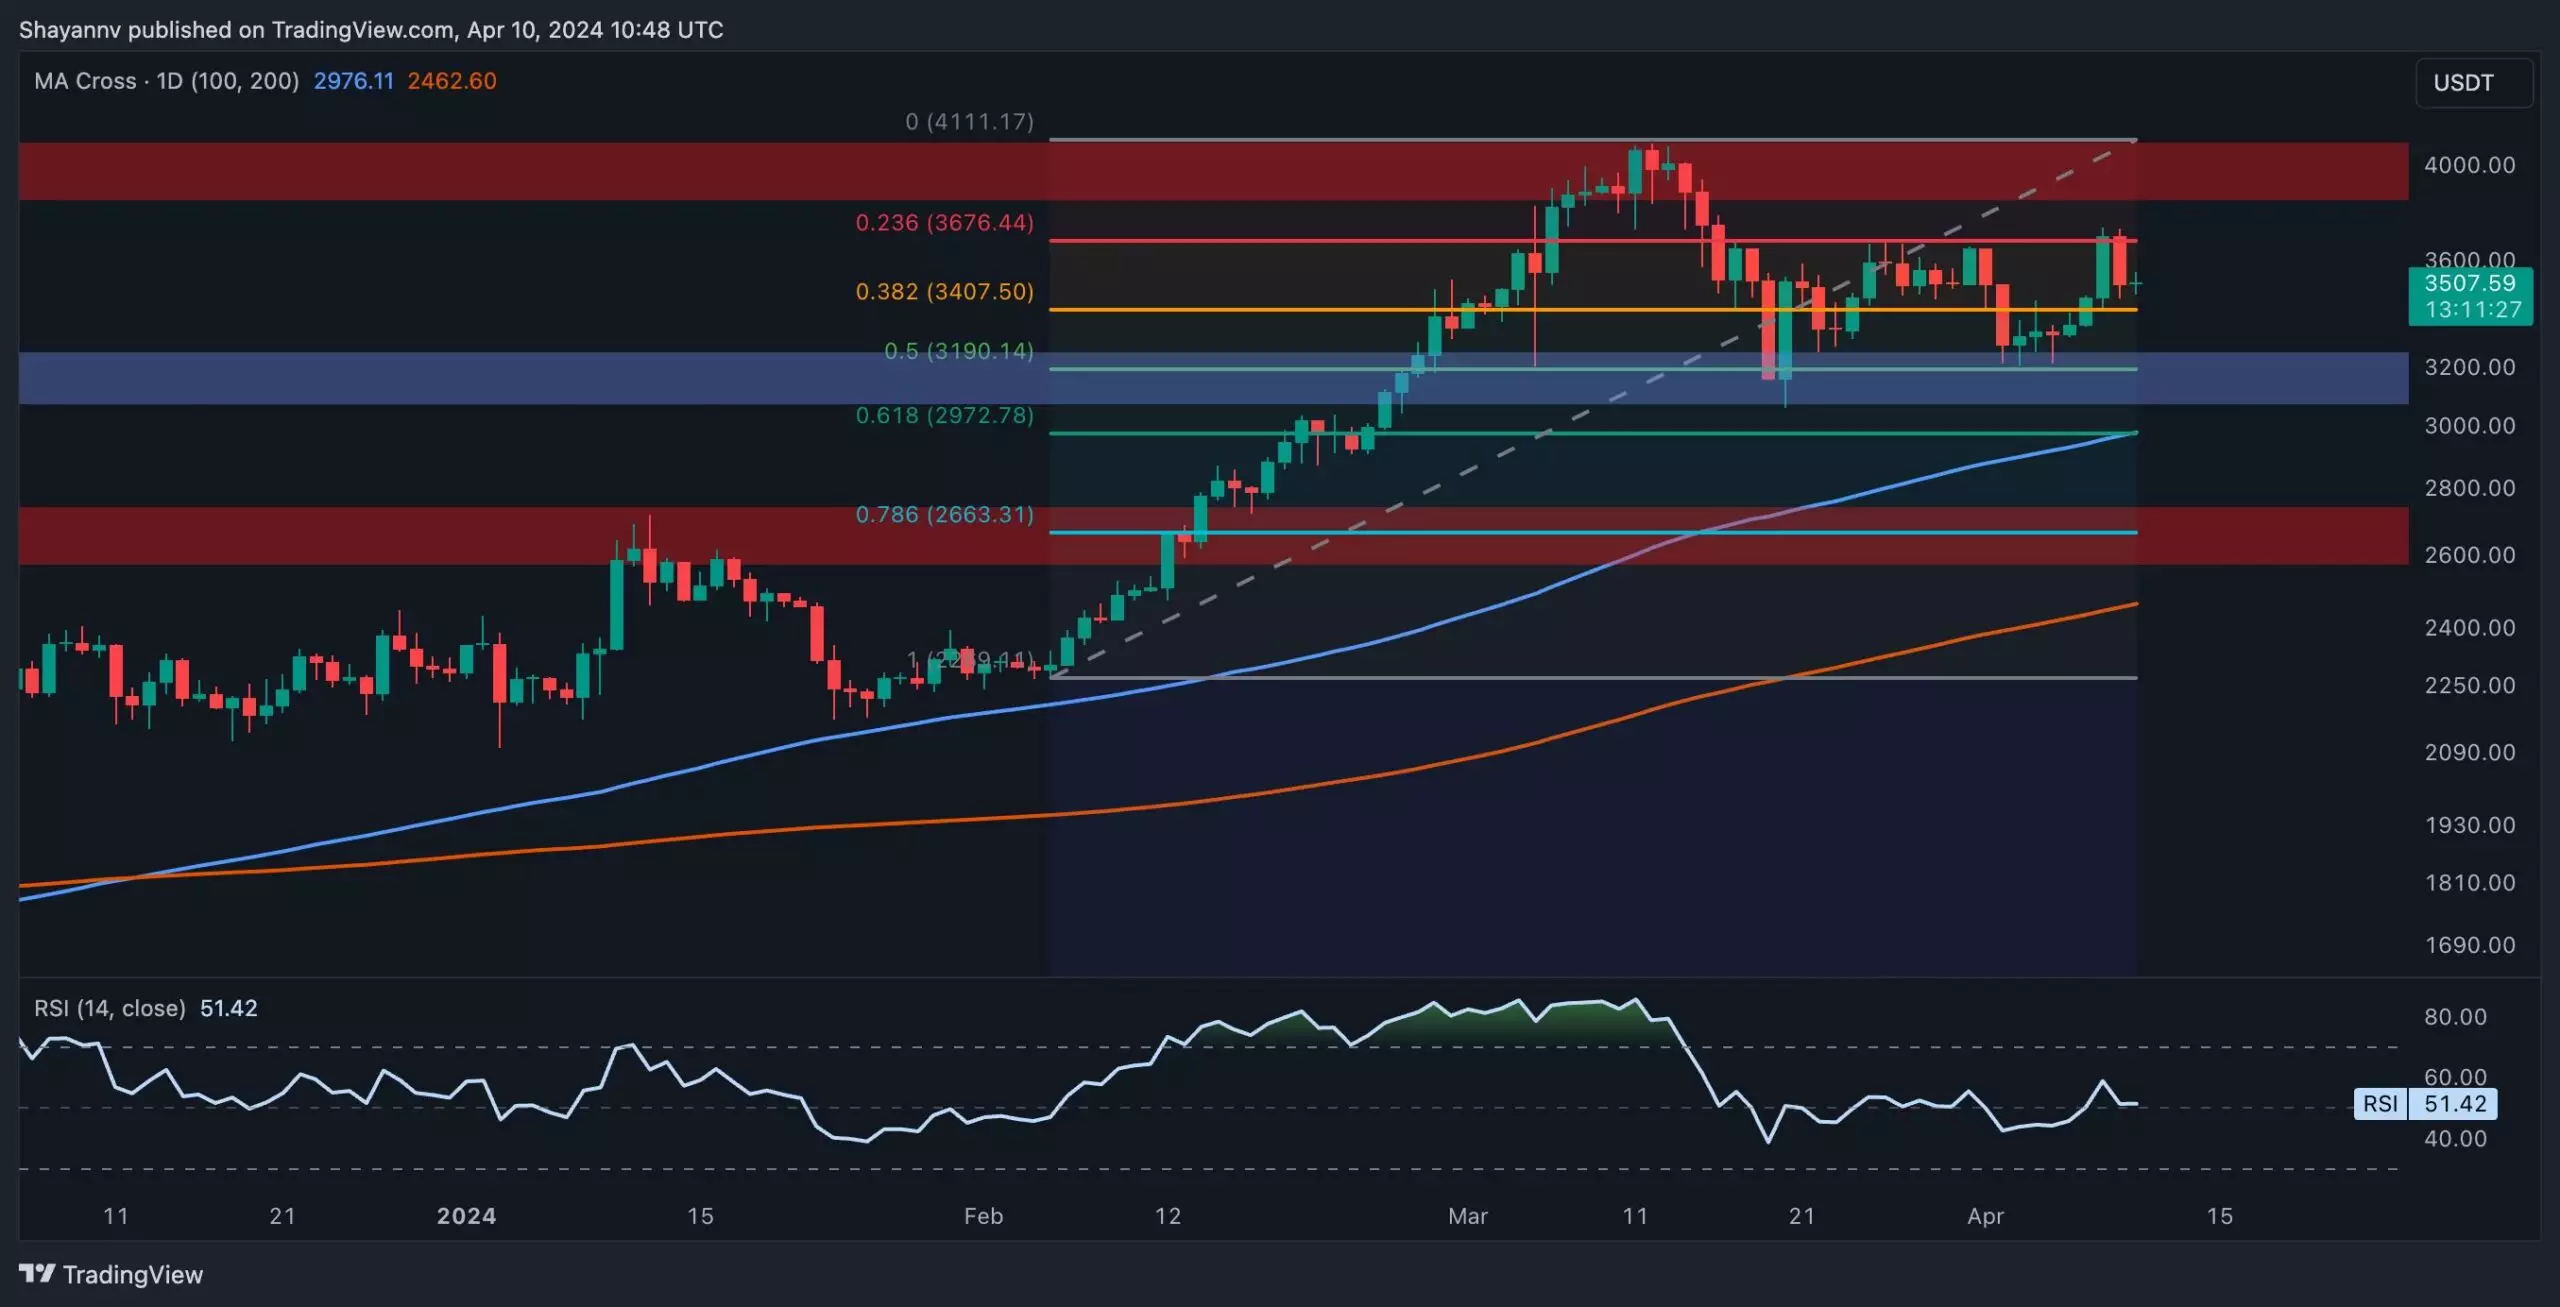
Ethereum’s price has been stagnant, moving sideways between $3K and $3.7K after reaching a critical support level of $3K. The daily chart shows a prolonged consolidation phase after finding strong support at $3K, which aligns with significant Fibonacci retracement levels and the 100-day moving average. Despite attempts to break out of the range, the price has met resistance near $3.7K, indicating a struggle between buyers and sellers.
A closer look at the 4-hour chart reveals the formation of a sideways wedge pattern during corrective retracements. Such patterns typically signal a continuation of a bullish trend upon breaking out from the upper boundary. Ethereum experienced buying pressure around the $3K support level, leading to a bullish momentum that breached the upper boundary of the wedge. However, resistance at $3.7K caused a slight retracement, with the price now potentially completing a pullback before another upswing. There is a possibility of a bearish retracement towards $3.2K if the pullback fails.
The exchange reserve metric, which measures the amount of ETH held on exchange wallets, shows a decrease below the 30-day moving average after a recent increase. This decline indicates that investors are withdrawing ETH from exchanges, signaling spot buying pressure in the market. The demand in the spot market is crucial in determining a sustained rally, potentially leading to a more stable uptrend in Ethereum’s price.
Ethereum’s price movement is currently trapped in a range between $3K and $3.7K, with buyers and sellers vying for control. The formation of patterns like the sideways wedge suggests a potential break in the consolidation phase, with the spot market demand playing a significant role in determining the direction of Ethereum’s price. Traders should monitor key support and resistance levels closely to gauge the future movement of the cryptocurrency.


