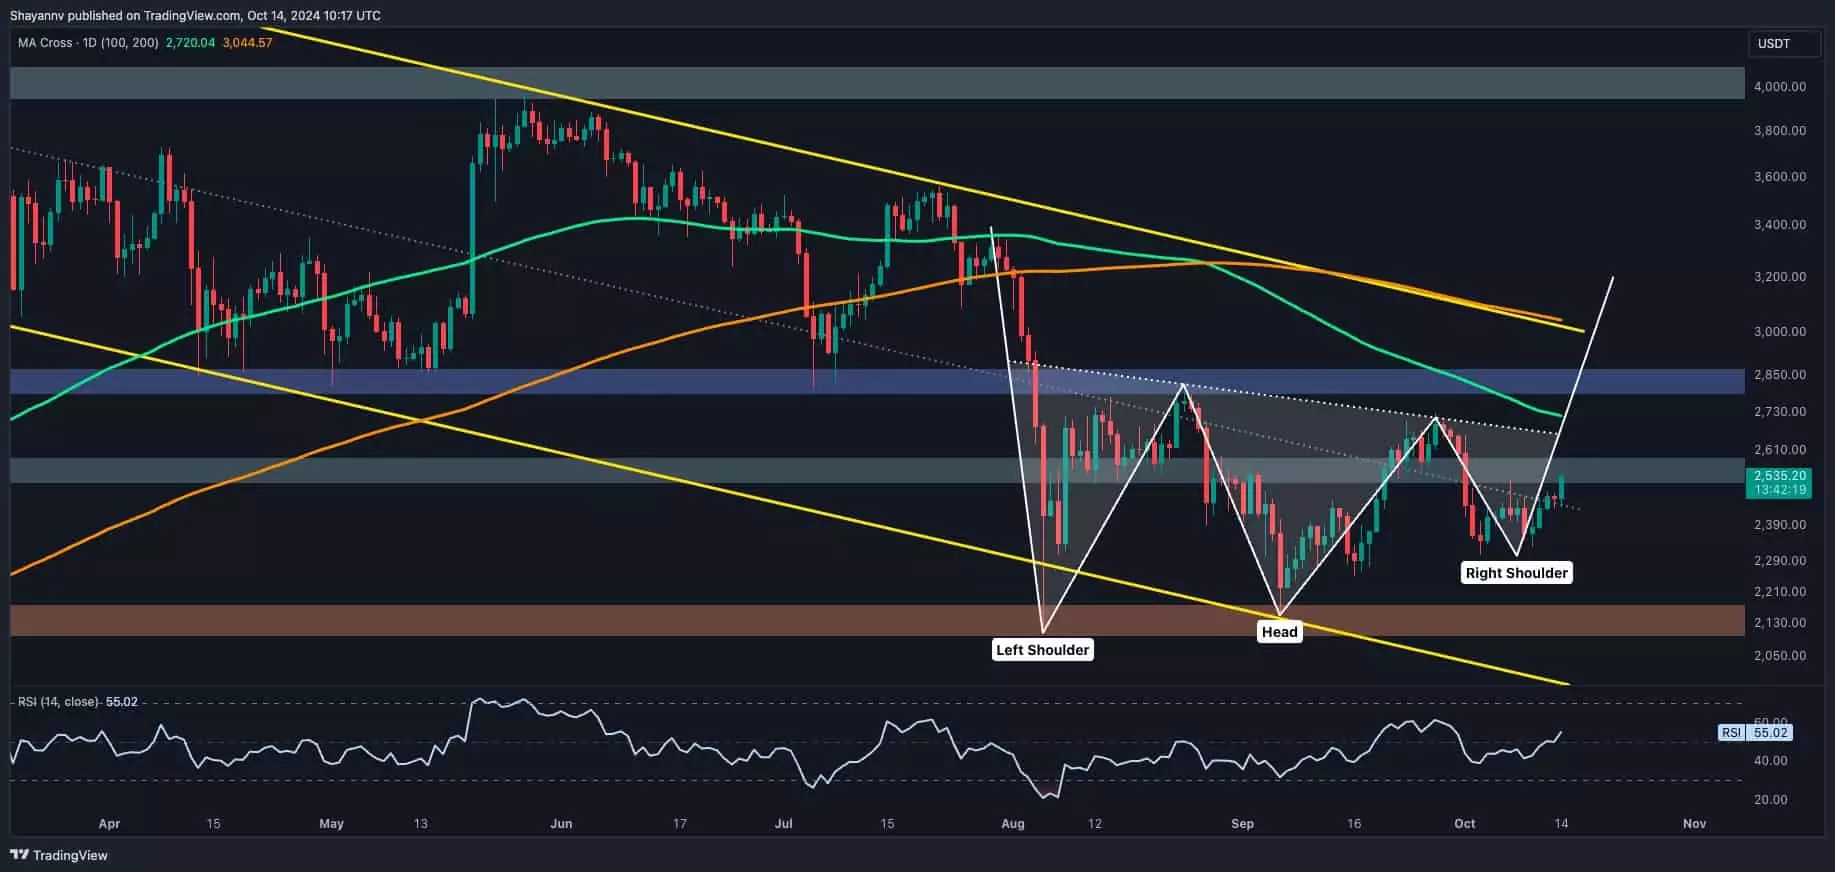
Ethereum, the second-largest cryptocurrency by market capitalization, finds itself at a pivotal point in its trading journey. Recent technical analysis reveals the formation of an inverted head and shoulders pattern on its daily chart, coupled with a double-bottom pattern emerging on the 4-hour chart. These formations collectively suggest a potential bullish reversal. As Ethereum navigates this landscape, two critical price thresholds emerge: the $2.7K neckline and the $2.1K support level. The behavior of the asset around these price points will likely dictate its immediate future trajectory.
The market for Ethereum has experienced descending consolidation, which has left many traders and analysts torn between bullish and bearish sentiments. This ambiguity highlights the inherent volatility that defines the cryptocurrency market. Nevertheless, the inverted head and shoulders pattern near the $2.1K support zone brings forth a glimmer of hope for those anticipating an upward trend. Historically, this pattern signifies the possibility of a bullish resurgence, particularly if Ethereum successfully surmounts the $2.7K neckline.
Critical Analysis of Support and Resistance Levels
A closer examination reveals that Ethereum has recently reclaimed the midpoint of a multi-month trading channel situated around the $2.5K mark. This development is pivotal, as it indicates a potential shift in the market’s sentiment. Should Ethereum breach the $2.7K neckline, the focus will likely pivot to a potential target of $3K, a significant psychological and technical resistance level. This target fundamentally reflects not only traders’ sentiments but also the broader market dynamics influencing Ethereum’s price action.
On the 4-hour timeframe, another narrative unfolds: Ethereum sellers have encountered challenges in driving the price below the ascending flag pattern’s lower boundary, which resides near the $2.3K mark. This dynamic support level has been persistently tested, highlighting its importance. Should this level be broken, it could incite a long-squeeze event, rapidly drawing Ethereum down to the $2.1K support level. At the same time, the formation of a double-bottom pattern suggests that, despite the selling pressure, buyers are stepping in. This duality in price action presents an intriguing scenario for traders monitoring Ethereum’s movements.
The Implications of Liquidity Zones
Ethereum’s trading dynamics are further complicated by the factors of liquidity and market participants’ behaviors. Analyzing the Binance liquidation heatmap unveils critical liquidity zones that could significantly impact any forthcoming breakout. Notably, the $2K region is characterized by sustained defense from larger market players, including institutional traders who have established significant liquidity pools. This protective dynamic underlines the importance of maintaining stability in this price area, as breaches here could disrupt the overall market sentiment.
Conversely, the $2.8K resistance zone serves as a formidable barrier. With a significant concentration of liquidity present, any attempts by Ethereum to breach this barrier might trigger a cascade of liquidation events. The positioning of stop-loss orders and liquidation levels by larger traders adds an additional layer of complexity to the situation. Such factors indicate that Ethereum is not just at a crossroads symbolically but also at a junction where traders must weigh their risks carefully.
Ethereum’s current price action emphasizes the importance of monitoring both support and resistance levels and understanding how key market dynamics affect price movements. The dual formations on the charts point toward a potential bullish resurgence, yet the outcome remains heavily contingent upon subsequent price actions around $2.7K and $2.1K.
As consolidation effects continue to play out, volatility may eventually increase as traders react to movements across these crucial zones. The analytics derived from liquidity zones further underscore that Ethereum sits in a delicate balance between bullish prospects and the risk of significant downtrends. Ultimately, Bitcoin’s intricate tapestry of price dynamics may yet yield opportunities, but discipline and vigilance remain indispensable for traders navigating this cryptocurrency’s ever-changing landscape.


