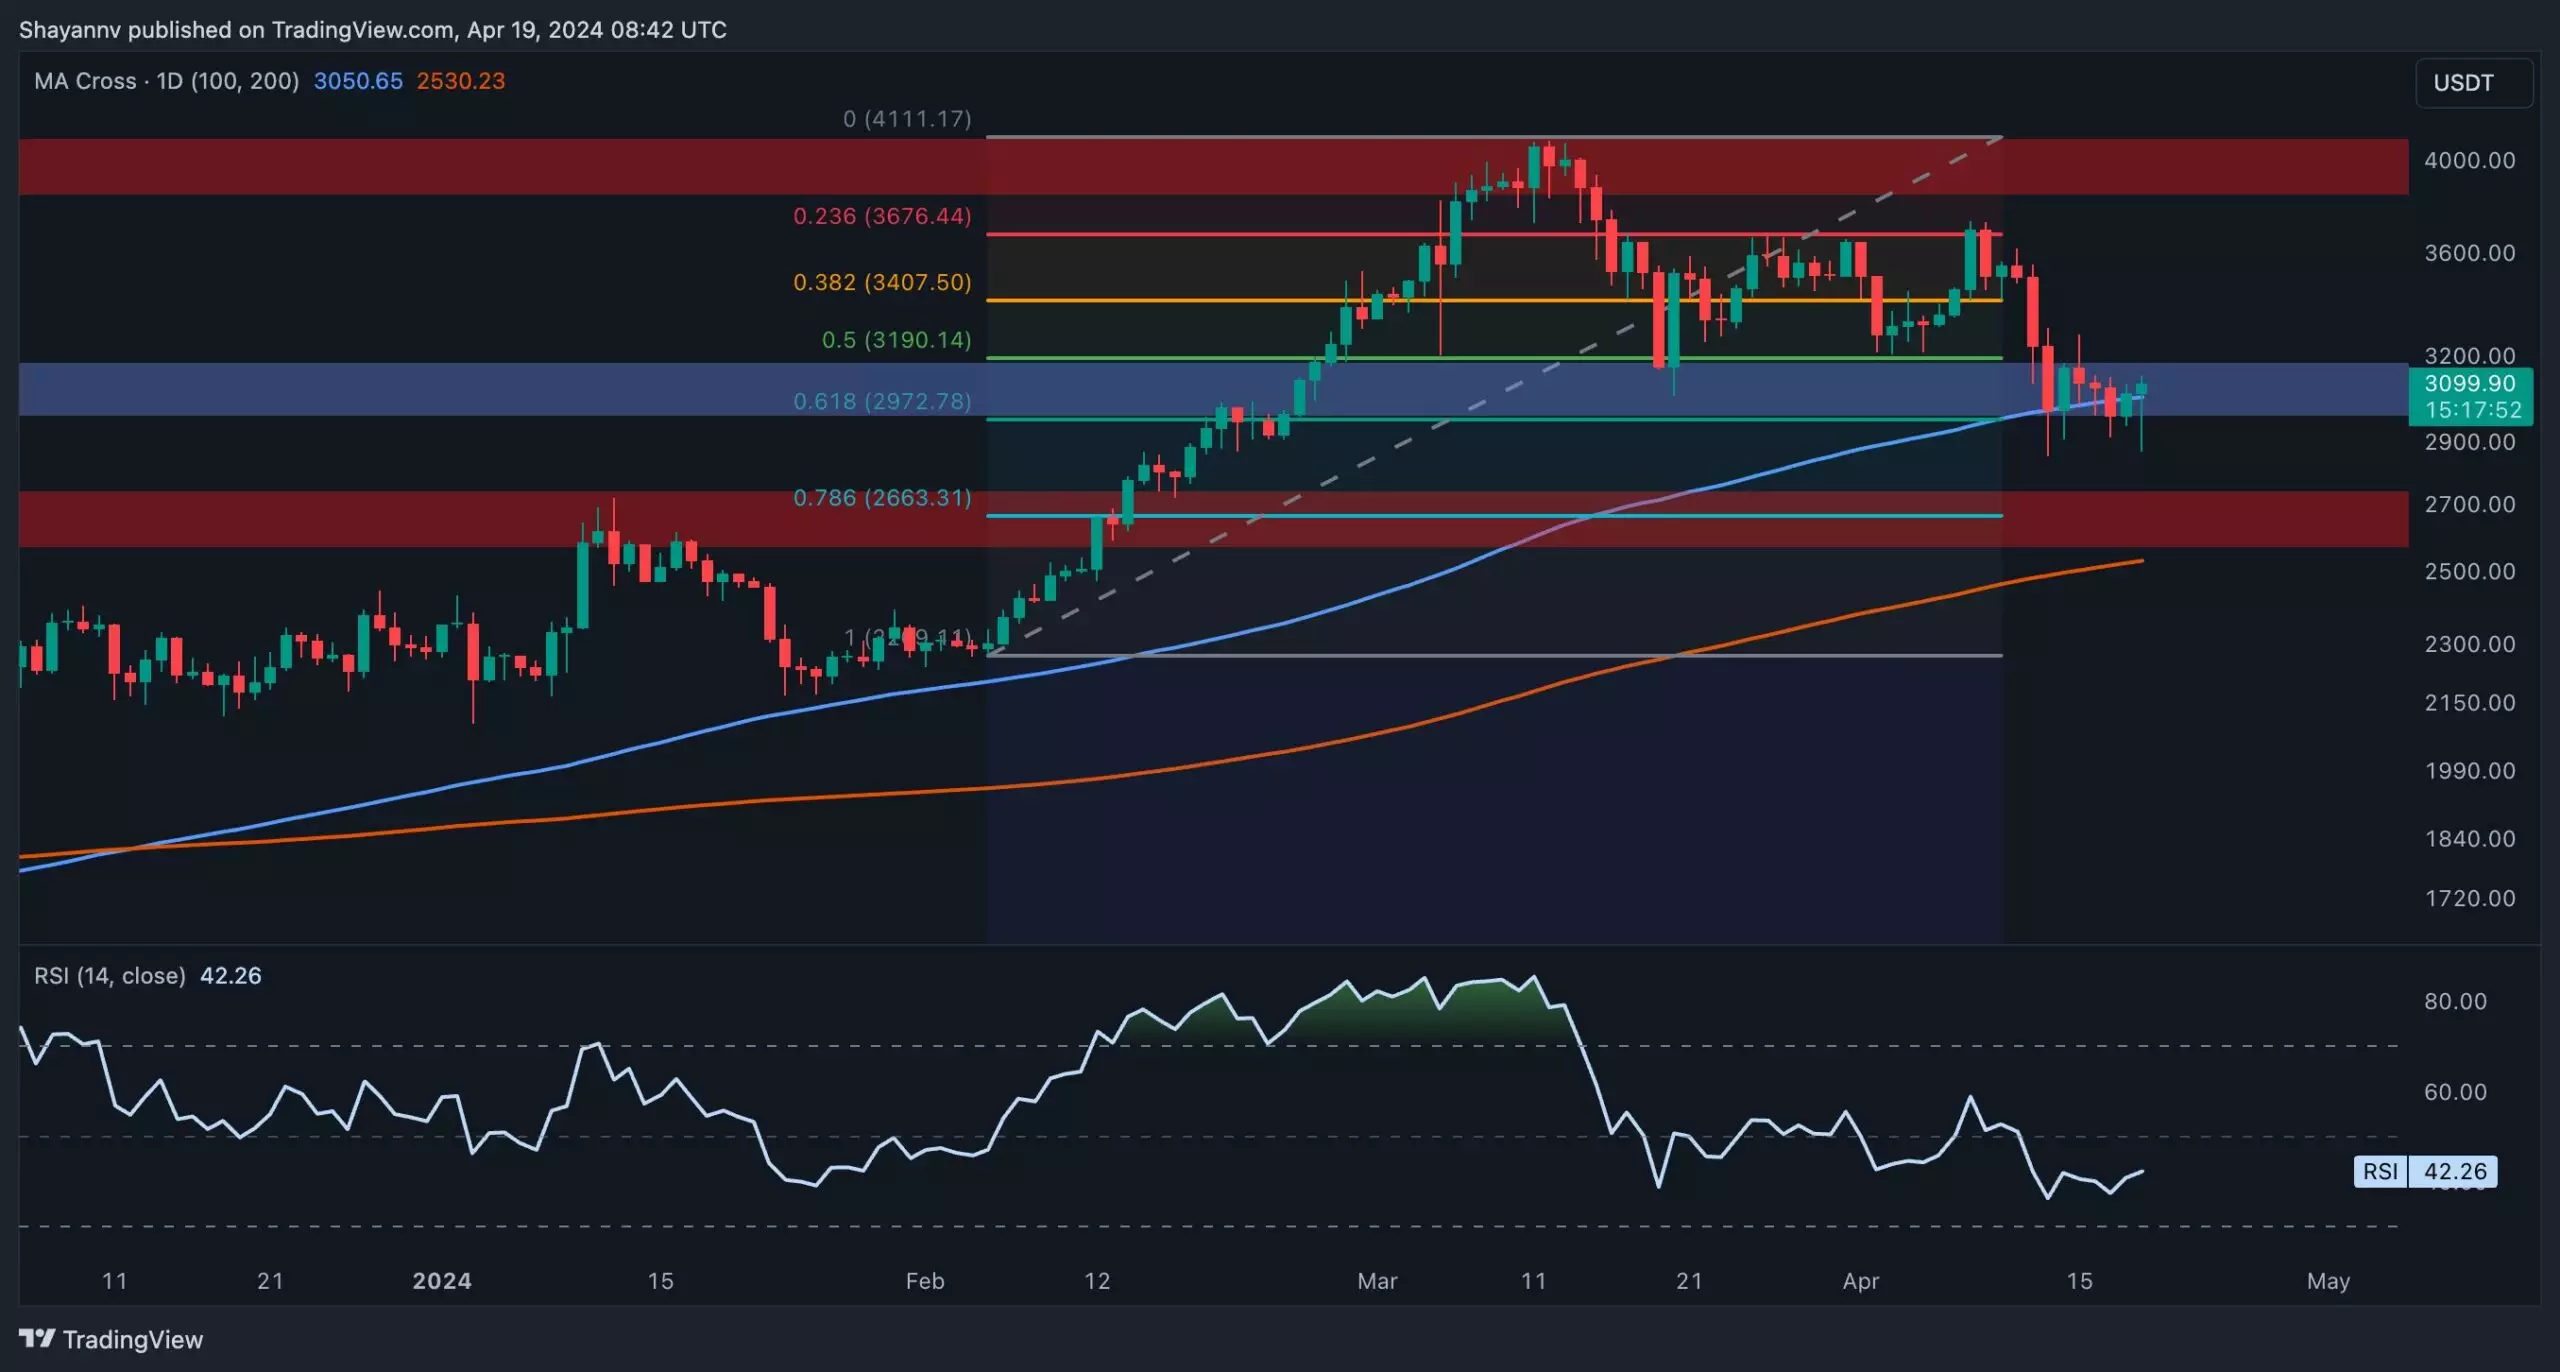
Following a period of corrective retracements, Ethereum has found support within a crucial zone that includes the 100-day moving average at $3050 and the price range between the 0.5 ($3190) and 0.618 ($2972) Fibonacci levels. This area is significant as it attracts demand and may prevent further downward pressure from sellers. Additionally, a minor bullish divergence between the price and the RSI indicator suggests the possibility of a bullish resurgence, aiming to reclaim the $3.5K threshold. However, a breach below this support zone could lead to a downward cascade towards the 200-day moving average at $2.5K.
On the 4-hour chart, a descending wedge pattern has emerged during a multi-month consolidation correction phase. The price has declined significantly and has now reached the lower boundary of the wedge and the support area around $3K. Despite the potential buying pressure within this critical range, the price is currently consolidating with minimal volatility. This price action reflects a battle between buyers and sellers. Nevertheless, a divergence between the price and the RSI indicator on the 4-hour timeframe indicates the strength of buyers, increasing the chances of a bullish upswing in the medium term. If this scenario unfolds, the next target for the price would be the critical resistance level at $3.5K. However, a break below this support could result in a descent towards the $2.7K support level.
As Ethereum’s price shows signs of recovery, it is essential to assess whether this resurgence is driven by spot buying or leveraged futures activity. One key metric for this analysis is funding rates, which indicate market sentiment – positive values indicate bullishness, while negative values suggest fear. Despite the recent downtrend in Ethereum’s price, the funding rate metric has followed a similar trajectory, steadily decreasing until reaching near-zero levels. This trend implies that the recent price drop has led to the liquidation of a significant number of positions in the perpetual market, resulting in a cooling effect on the futures market. As a result, the market may be poised for a resurgence in long positions, potentially leading to an upward surge in the price.
Ethereum’s price is currently supported by a crucial zone, indicating the potential for a bullish rebound in the medium term. The formation of a descending wedge pattern and the analysis of funding rates provide additional insights into the market sentiment and the factors driving Ethereum’s price movements. Traders and investors should closely monitor these developments to gauge the future direction of Ethereum’s price and make informed decisions regarding their positions.


