Bitcoin, the leading cryptocurrency, finds itself in a precarious predicament, oscillating within a narrow price range that raises more questions than answers. Following a significant decline from its previous peak of $100,000, the cryptocurrency has struggled to establish a definitive trajectory. As market participants deliberate whether we are witnessing accumulation—where investors are buying in anticipation of higher future prices—or distribution—where sellers are offloading assets in anticipation of further price declines—the coming days will likely reveal more about market sentiment.
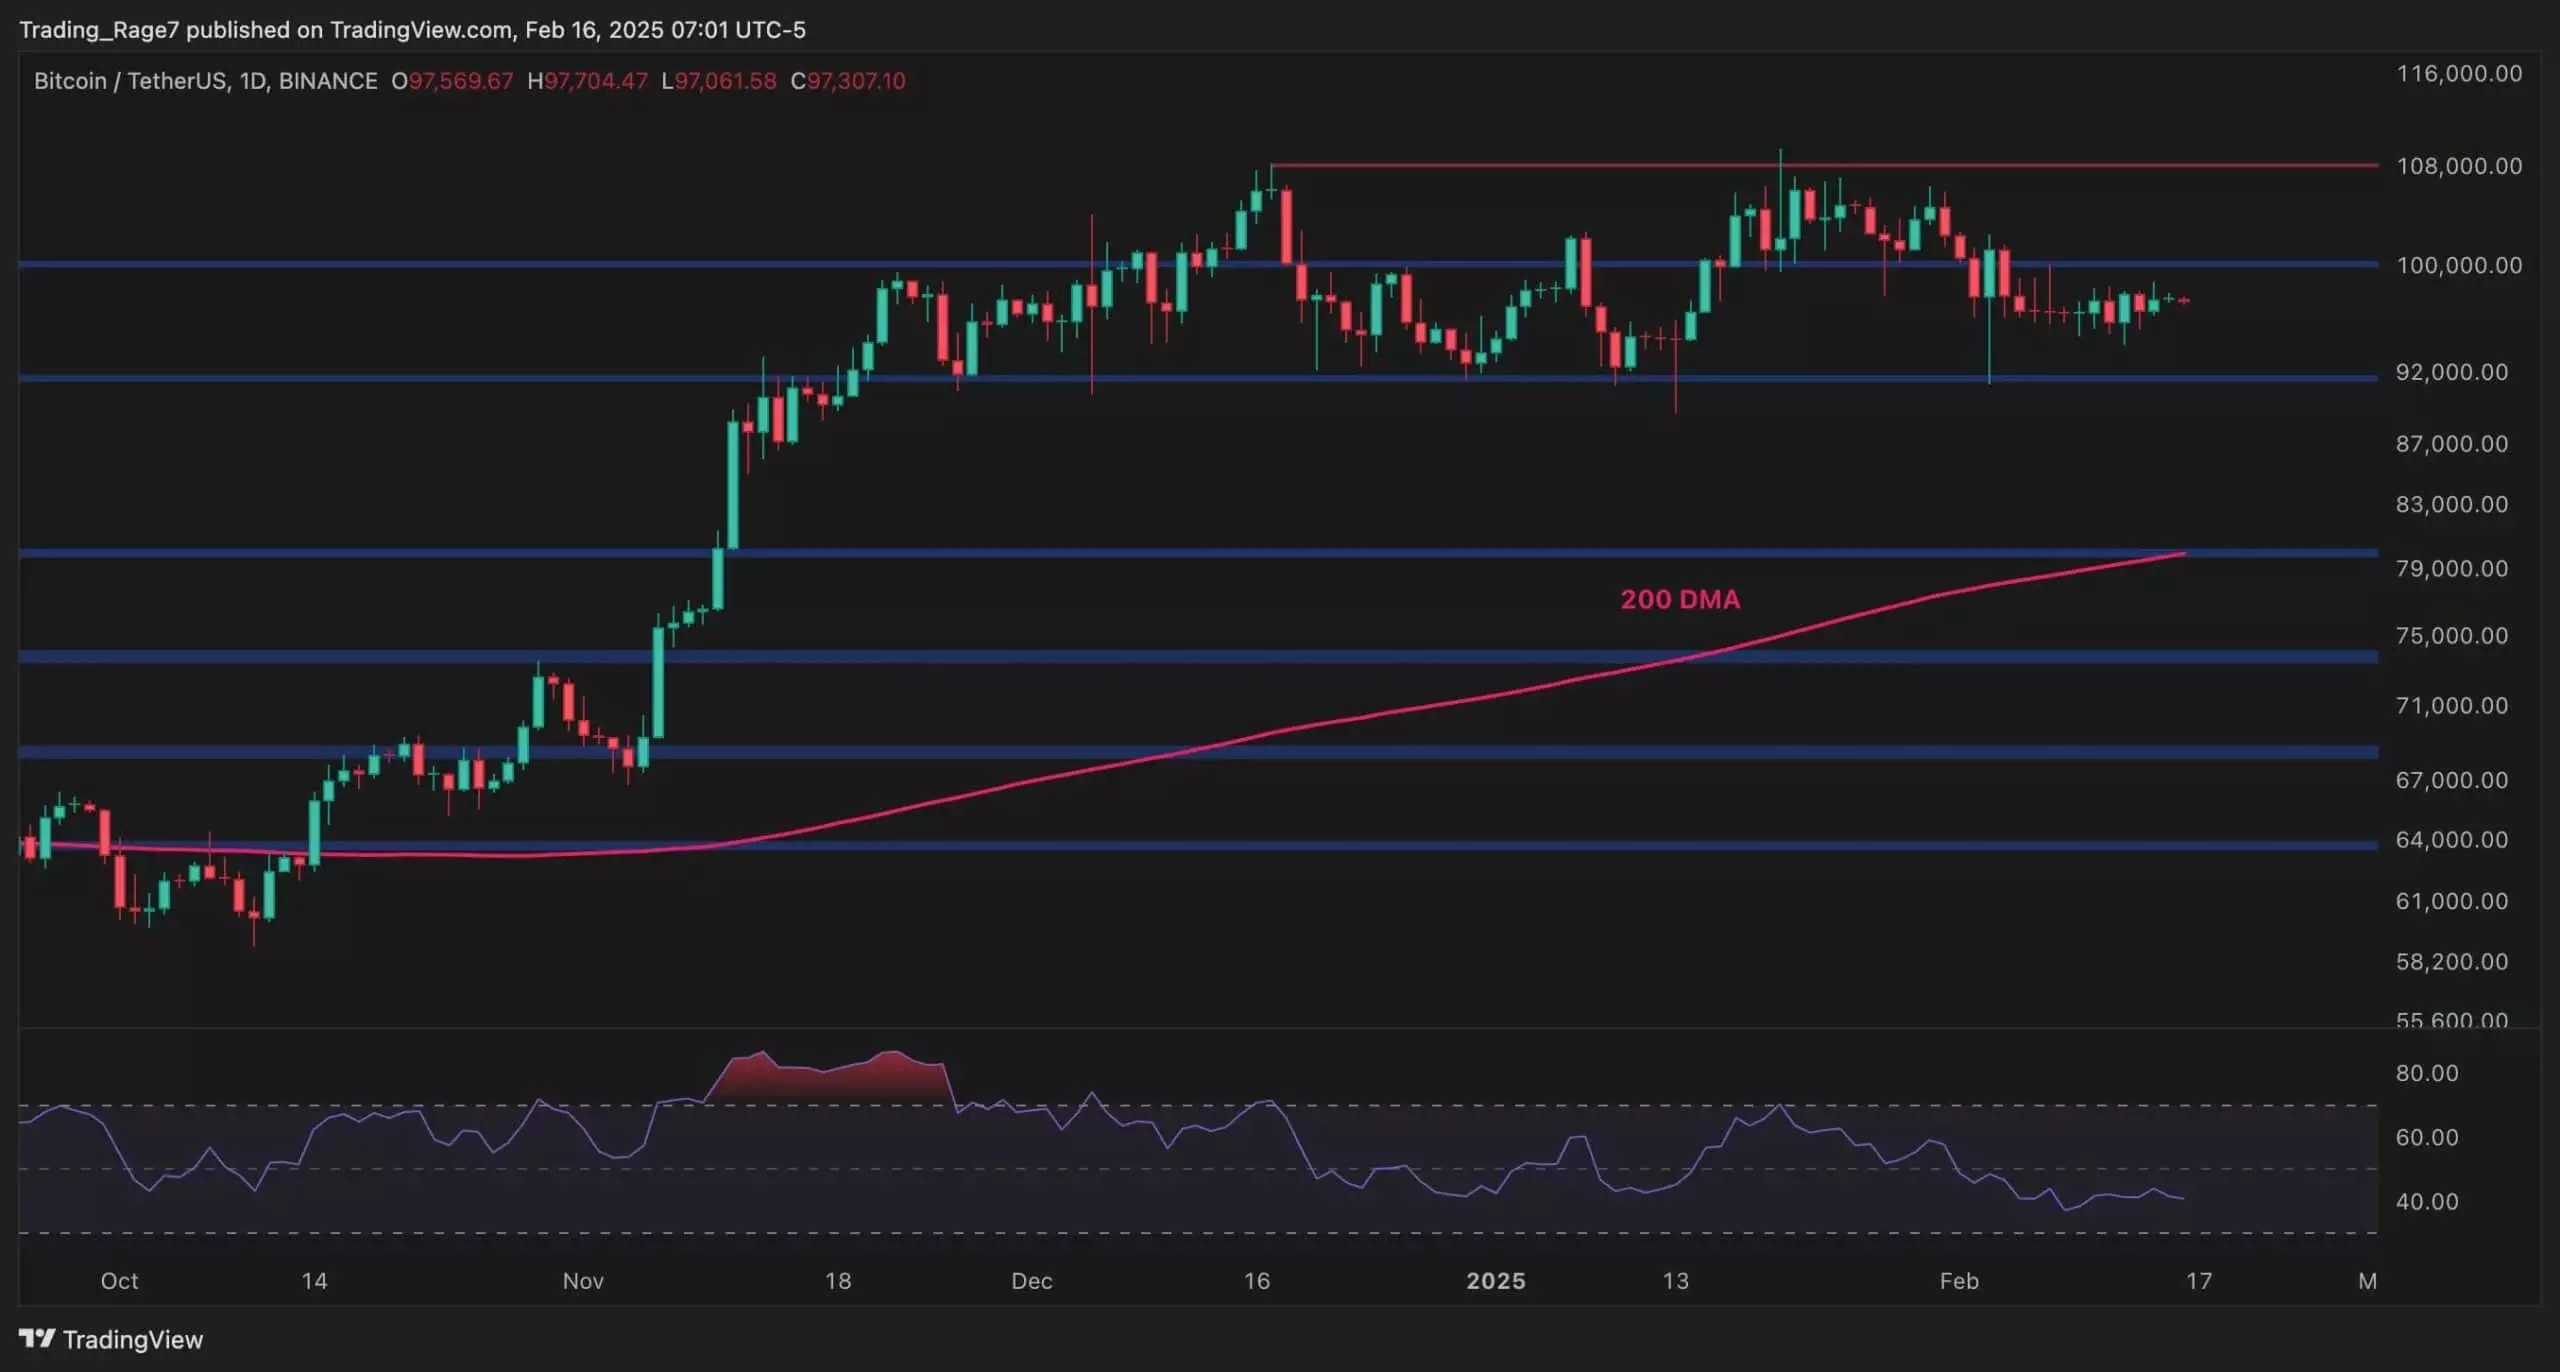
Monitoring the daily price charts reveals that Bitcoin is stabilizing around the $92,000 mark, a level that currently serves as a critical support structure. This stabilization comes with a bearish undertone, as indicated by the Relative Strength Index (RSI) hovering beneath the 50% threshold. A compelling aspect of this situation is Bitcoin’s positioning above the 200-day moving average, which is currently pegged around $80,000. This key technical level suggests that there is still an existing bullish sentiment in the long term; however, the threat of a further drop cannot be discounted.
Shifting attention to the 4-hour chart, market observers note the formation of a symmetrical triangle, a price pattern that often indicates a potential breakout either upwards or downwards. The previous price rejection at the upper boundary of this triangle hints at an imminent test of the lower boundary, and with the RSI dipping further below 50%, the odds of a bearish breakout appear to mount. Should the price breach the lower threshold, a pullback towards the $92,000 level could swiftly ensue, reigniting fears of a fuller retracement.
An essential factor in discerning Bitcoin’s future movements is understanding the underlying market sentiment, primarily driven by accumulation and distribution behaviors among traders. Recent movements reveal a notable decline in Bitcoin reserves held on exchanges—a metric that serves as an indirect indicator of selling pressure. A decrease in exchange reserves can typically signify that holders are opting to store their Bitcoin in private wallets, hinting at long-term bullish sentiment.
However, an unexpected uptick in these reserves in the last few days indicates growing uncertainty amid traders, possibly signaling a lack of confidence in a significant price rally over the near term. If the trend of increasing exchange reserves persists, it could intensify selling pressure, putting downward pressure on Bitcoin’s price in the days to come.
Bitcoin’s current market dynamics reflect a state of limbo, where uncertainty reigns supreme. The interplay between support and resistance levels, alongside the mixed signals from technical indicators and accumulation metrics, requires a watchful eye. As traders navigate this turbulent landscape, understanding the broader trends in market sentiment will be crucial in making informed decisions about future positions in the ever-evolving realm of cryptocurrency. Whether we witness a bullish resurgence or a deeper correction remains an open question, one that will become clearer as the situation unfolds.


